Available on

Features

Monitoring
The Monitoring tab is the first screen you see when logging in to your Unitracker LIVE portal, it gives access to all the main tracking features. From here you can watch the movement of units on the map, send commands and messages to them, request photos and videos, monitor changes in real time online, etc. Within here you can see a list of vehicles which you can monitor on the map. The list can contain either all units available to you or just some of them. You can easily add and remove units from the list, which does not lead to their removal from the system. Next to the name of each unit, there can be icons that allow you to assess the state of the unit or perform certain actions. Above them, in the header of the table, there are icons which allow you to order units according to various parameters. To display the icons in the work list, configure the monitoring options.
To locate a unit on the map, click on its name, the map then centers and zooms in on the selected unit.
The vehicles are shown on the map if the Monitoring layer is activated in the visible layers menu. The map displays only those units that are selected in the list. You can select all units at once by selecting the check box in the top left corner or to cancel the selection of all units, clear the check box.
If you would like the map view to lock on to a specific vehicle then click on the Watch unit icon. When a new message is received from such units, the map is automatically scaled so that you can see them.

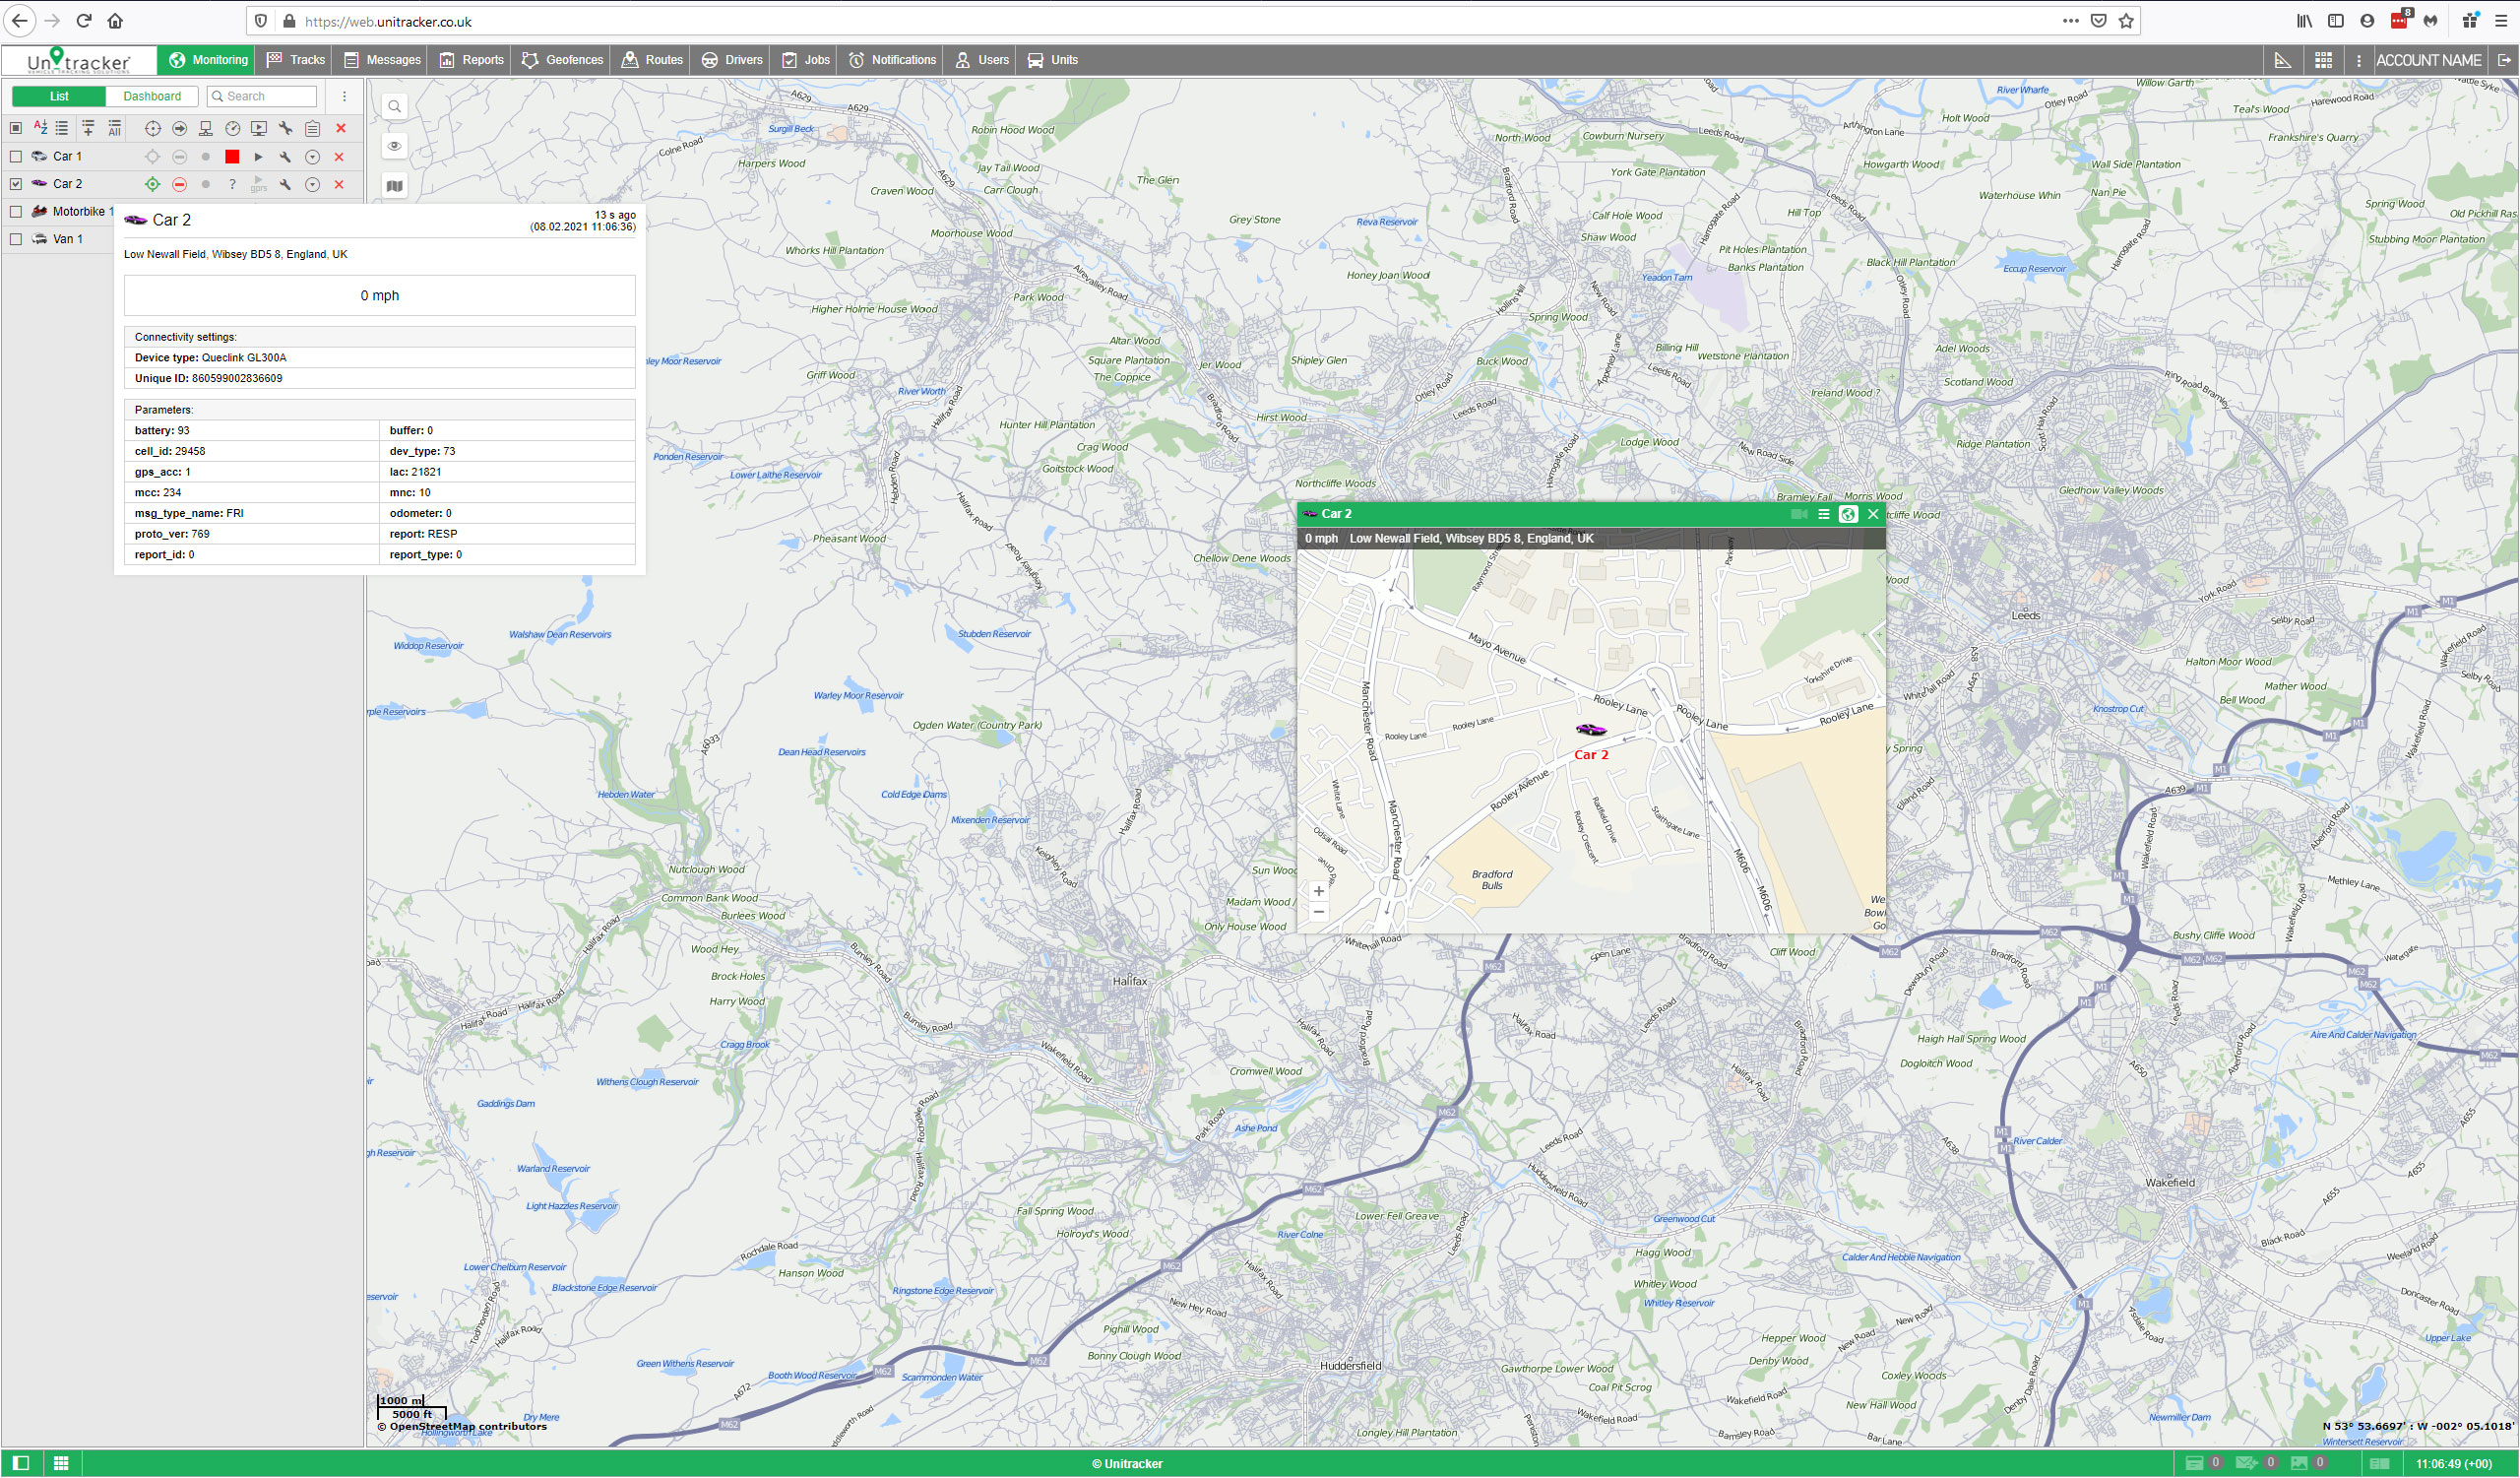
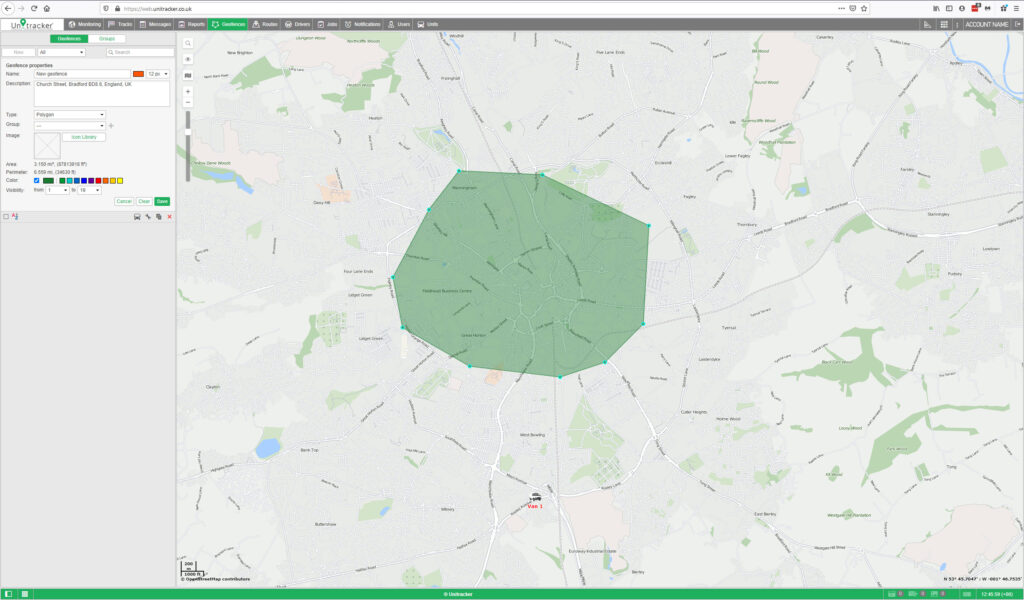
By default, your vehicles are displayed by an icon which is selected when the unit is configured, and a caption with its name. Icons for units can be selected from a standard set or you can use your own image by uploading it in the Icon tab in the Unit Properties box. In addition, the icon can rotate depending on the direction of the vehicle in real time. This feature is also defined in the Unit Properties.


Alternatives for Icons

Unit icons can be replaced with the motion state signs. This option is called ‘Replace unit icons with motion state signs’ and is set in the user settings. The following symbols are possible:

  • Green arrow – The unit is moving, the direction of the arrow indicates the direction of movement.
  • Red square – The unit is not moving.
  • Yellow circle – The unit is standing with the engine on (only for units with ignition sensors).

The colour of the icon depicts the chosen sensor value. This can be adjusted in the Advanced tab of the Unit Properties.

Unit names can be displayed or hidden on the map using the Unit name item in the layers menu.


Displaying Inactive Units

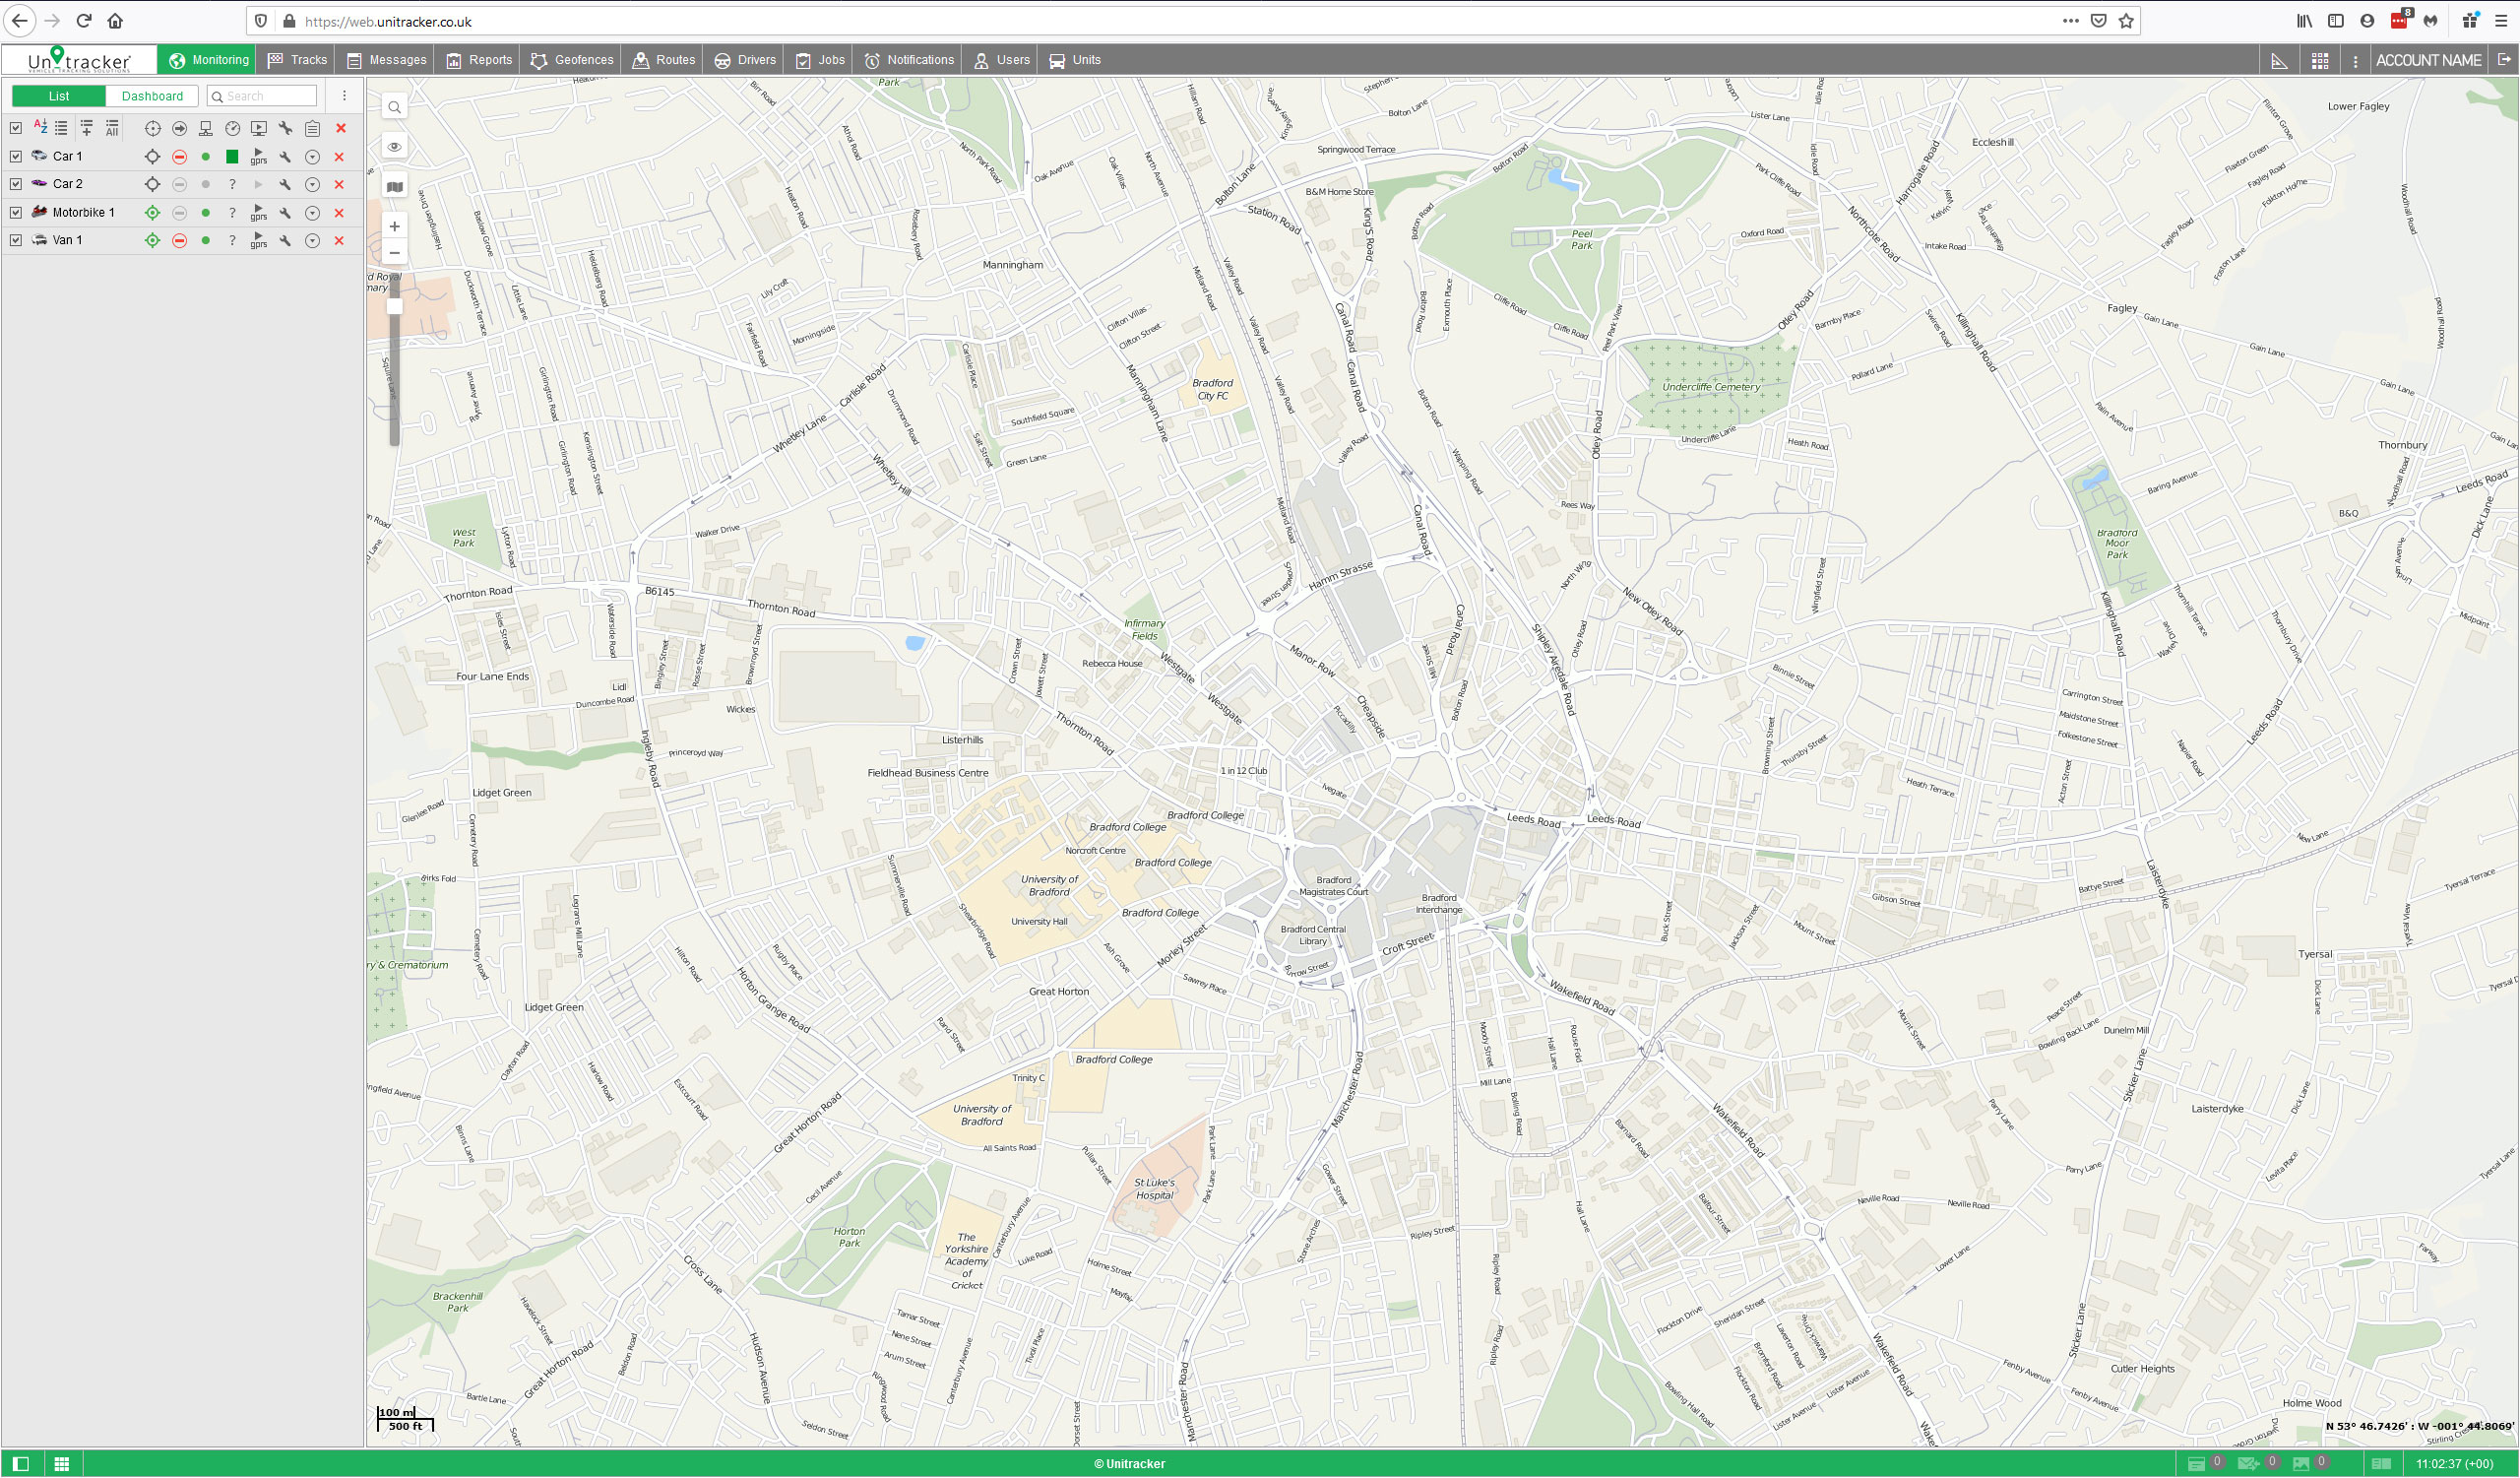
Monitoring units are conventionally divided into active and inactive ones. Inactive units are units that have not received messages for more than 48 hours all others are considered active.


Other Markings

If the unit is currently in motion, the green arrow shows the direction of its movement, and the unit can be followed by a trace which shows the track for the last few messages.


In the layers menu, you can configure the display with the following choices:

  • Unit trace – Show/Hide the trace of the unit;
  • Unit name – Show/Hide the names of the units;
  • Driver’s name – Show/Hide the drivers assigned to the units (if there are any);
  • Unit direction – Show/Hide unit’s direction of movement.

If the display of names is enabled both for units and drivers, the drivers’ names are shown in parenthesis. The colours of the captions are taken from the unit properties.


The icon to the left of the caption signals that the ‘Do not show unit location’ option is activated for the unit and the private mode of the trip is detected.

A minimap is an additional window which shows the selected unit. You can open a minimap by double clicking on the unit on the map or on the unit name in the Monitoring tab. If the server has not received any messages with coordinates from the unit, its minimap is not available.

Online Notifications in Minimaps

In minimaps you can view any notifications. When one triggers, the unit minimap is highlighted in red. If the minimap has been hidden, it is shown automatically. Select the Blink minimap option as a notification action to receive and view online notifications in minimaps. In the minimap header, you can see an icon indicating the number of unread notifications. Click on it to view them. Here you can read and delete notifications. To return to the initial mode, click on the icon again.

Working with Minimaps

In the header of the minimap, there is a unit icon and name so that you can easily find the required vehicle. The mode switches and the Close button are also in the header. You can open up to nine minimaps at the same time (one minimap per unit). You can hide or display all minimaps at once by clicking on the button in the left corner of the bottom panel. When you go to the Reports, Messages, and Routes tabs, the minimaps are automatically hidden to avoid excessive information. If needed, you can display them by clicking on the button in the bottom panel. When you leave these tabs, the minimaps are shown again automatically.

After logging in to the system, the last layout of minimaps is restored
Tracks
To locate a unit on the map, click on its name, the map then centers and zooms in on the selected unit.
The vehicles are shown on the map if the Monitoring layer is activated in the visible layers menu. The map displays only those units that are selected in the list. You can select all units at once by selecting the check box in the top left corner or to cancel the selection of all units, clear the check box.
If you would like the map view to lock on to a specific vehicle then click on the Watch unit icon. When a new message is received from such units, the map is automatically scaled so that you can see them.
To build a track on the Tracks tab, do the following:
  1. Select a unit in the dropdown list.
  2. Adjust the desired parameters for the track (color, thickness, etc.).
  3. Define the time interval within which you want to get the data.
  4. After filling in all the fields, press Show Track.
The principle of interval adjustment is the same as in the reports (see Query and View Reports). The third and fourth steps can be combined into one if you use one of the options from the buttons Today, Yesterday, Week, or Month.

A point-to-point track that is built according to the preset parameters will appear on the map (if the unit has any messages with the coordinates for the period). If it takes too long for the track to appear on the map, it means you either indicated an interval that is too long or your Internet speed is too low. If within the indicated period the unit was not moving, there will be no track on the map. However, it can be found in the list of tracks below, and the distance traveled will be listed as 0.

A track or its part can be displayed on the map as a dashed line. Such a situation indicates that the data in this part of the track might be inaccurate e.g., the maximum interval between the messages is exceeded (see the Advanced tab) or the number of satellites is less than 4.

When the private mode of the trip is detected (if the unit has the Private mode type sensor with the Do not show unit location option enabled), the work trips are connected with the straight dashed line.

Alternative methods to build a track on the map are:
  • On the Monitoring tab with the help of quick track buttons.
  • On the Messages tab when you view data messages.
  • On the Reports tab, if the appropriate option is selected in the report template.
Messages
The data sent by trackers is processed and stored in the database in the form of messages.
On the Messages tab you can view all messages received from units (coordinates, parameters, speed, etc.), as well as SMS messages received from them, commands sent to units and events registered in units history. You can also export any information you need to here.
To open the Messages tab, select a corresponding name in the top panel or click on the necessary item in the main menu customiser. The workspace of the panel can be divided into four blocks:
  • Top left corner you can set the parameters of your request.
  • Bottom left there is the statistics for current request or a panel to export/import messages.
  • In the top right section there is the map.
  • At the bottom right section there are the messages themselves.
The sectors can be resized (the left ones — in width, the right ones — both in width and height). To do this, click on the border between them with the left mouse button and while holding it, move the border to the right/left or up/down. At the same time, if less than 10% of the map is left while expanding the lower sector, the map automatically collapses. To return it, press on the line under the top panel.

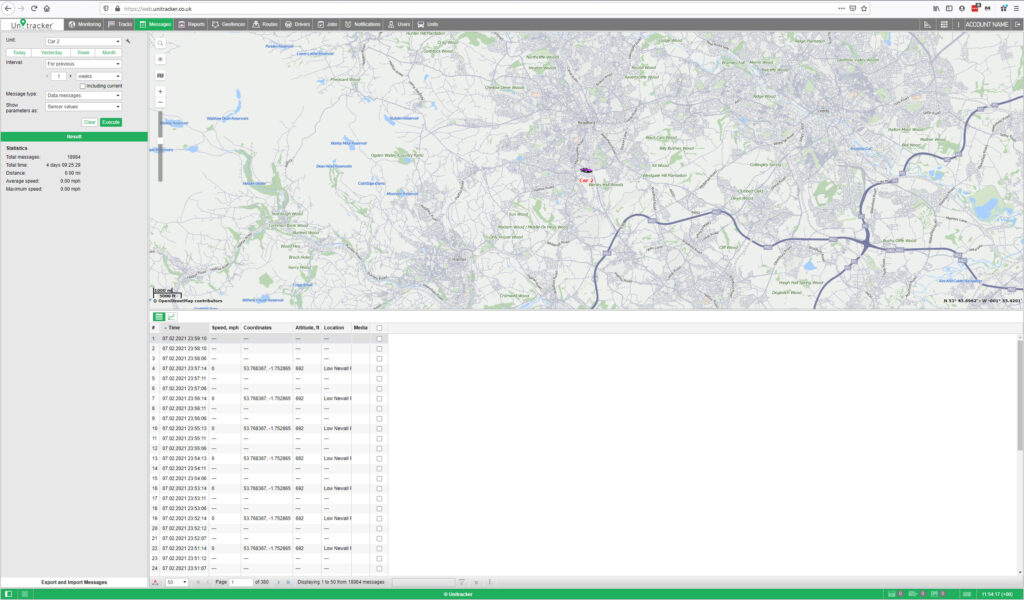
If you request messages with data, the table of messages will contain information about the time, speed, coordinates, location, and available parameters. In addition, in the Statistics section you can find summary information. There you will see the number of messages found upon request, the time from the first to the last message, the distance traveled, the average and the maximum speed.


There are two ways to display the parameters:


Raw Data – All the parameters are displayed in one line in the corresponding column.


Sensor Values – Each sensor has its individual column in the table, the values are given according to the calculation table. The information on each color and the message that corresponds to it is located in the Legend section.
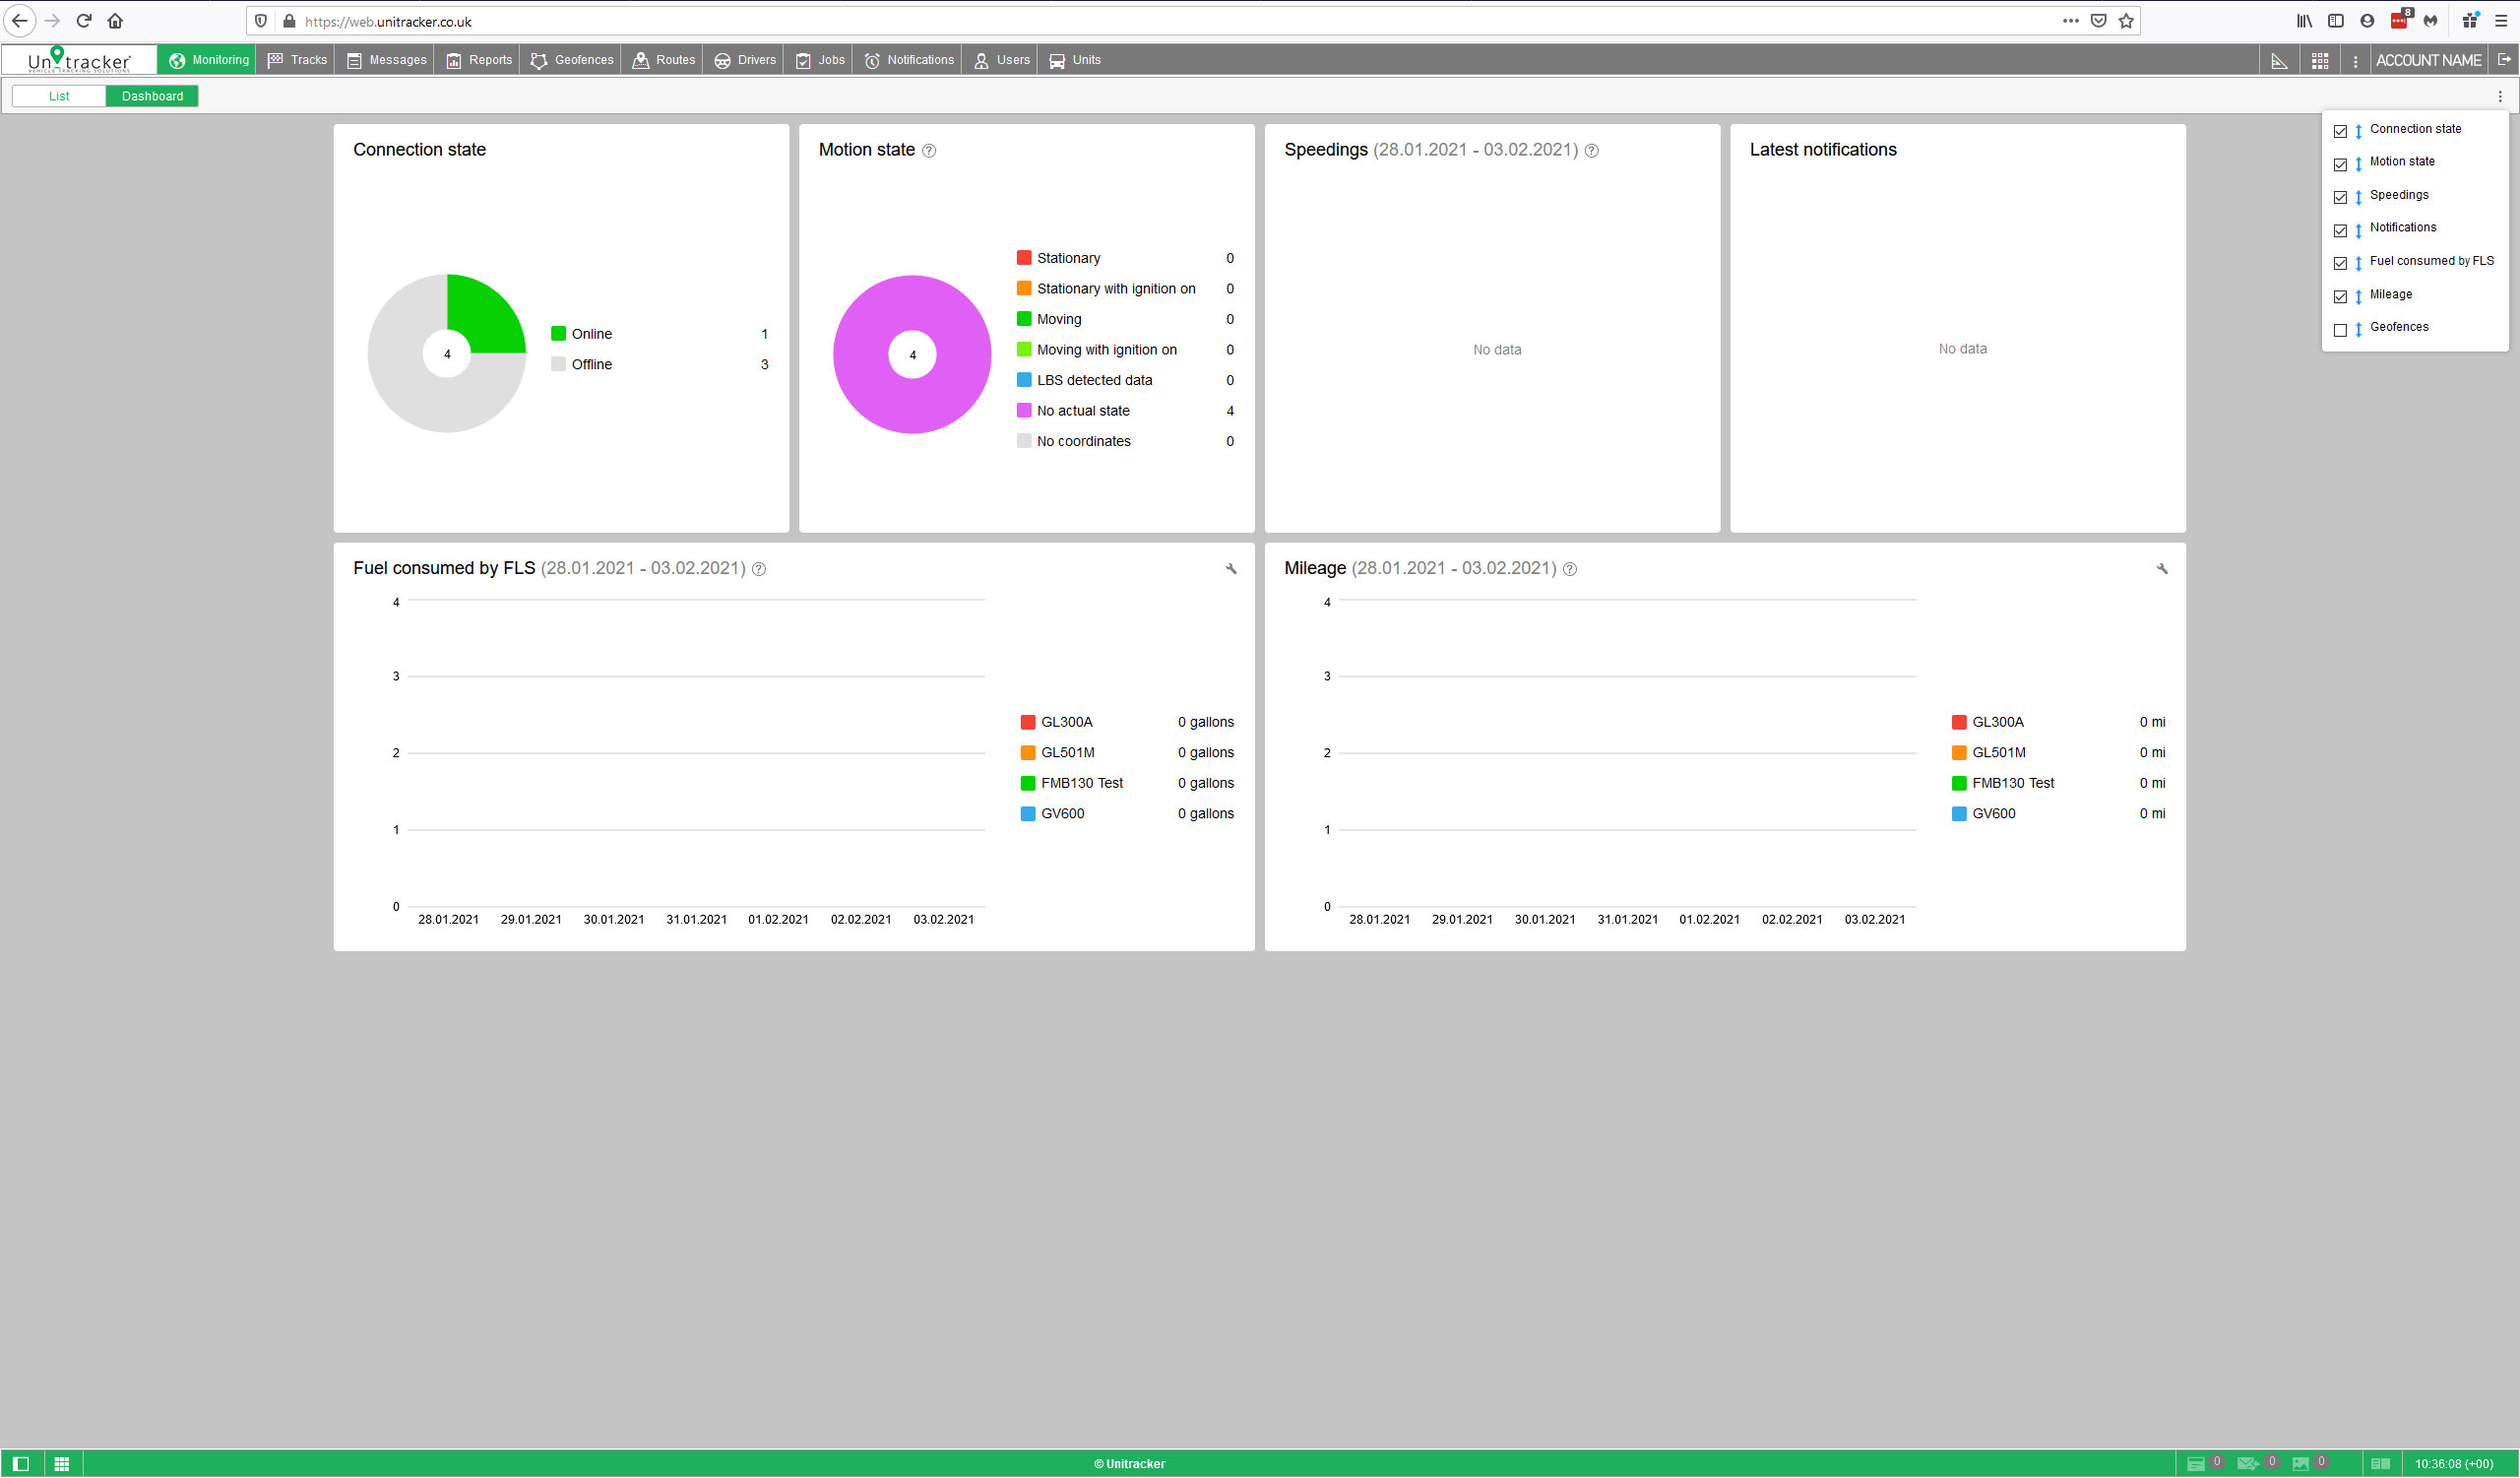
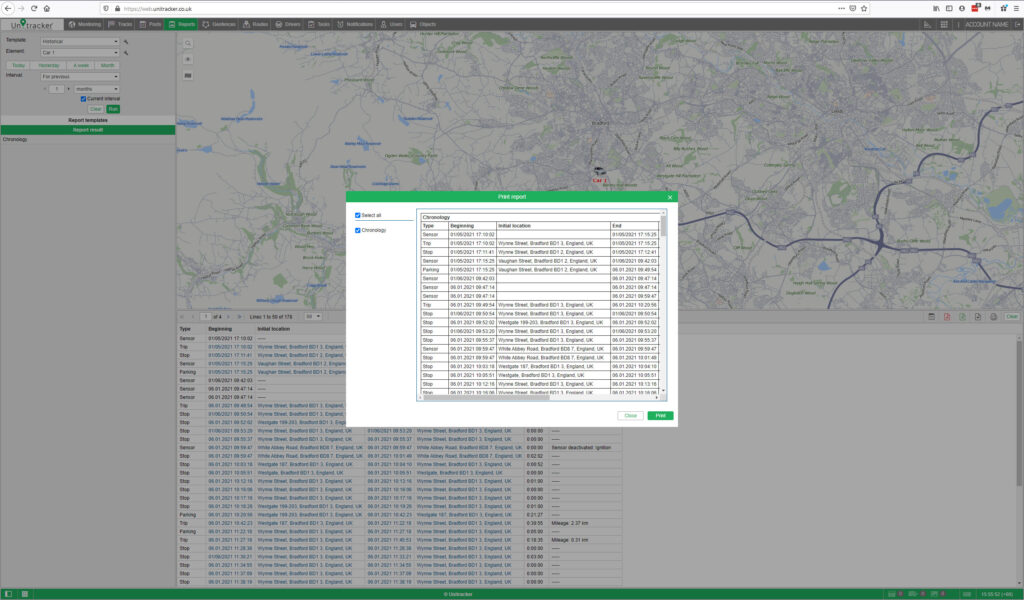

Statistics


Statistics section provides the general information about the request:

  • Total messages – The number of messages for the whole period.
  • Total time – The interval between the first and the last message of the selected period.
  • Distance – The distance traveled by the unit within the indicated time interval.
  • Average speed – The average of all speed values registered during the period.
  • Maximum speed – The maximum speed registered.

Using the Map


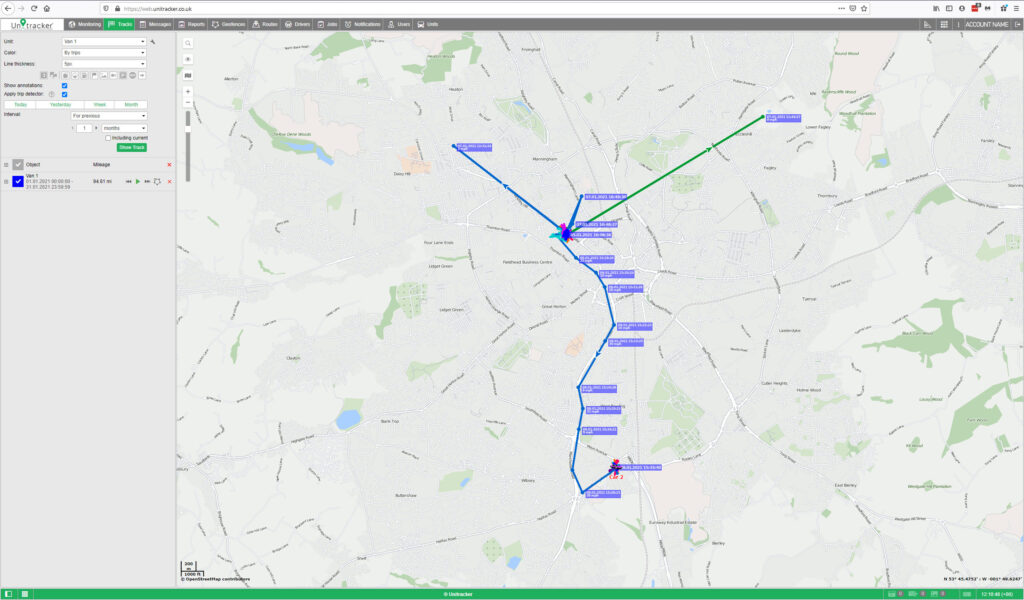
The track for the selected period is displayed on the map. It is generated together with the table. Select the message and click on it. The message will be highlighted in grey, the map will be centered on this point and a blue marker will be set there. By default, the track is blue, but you can adjust the settings to colour the track in accordance with the speed or sensor value. This can be set in the unit properties dialog on the Advanced tab.


When you hover the mouse cursor over the track, the nearest message is searched. If such a message is found within a radius of 50 pixels, the point of receiving the message is highlighted by a pulsating circle, and detailed information is displayed in the pop-up window: the time the message was received, the speed of the unit’s movement at that point, altitude, coordinates, number of satellites, readings of sensors.
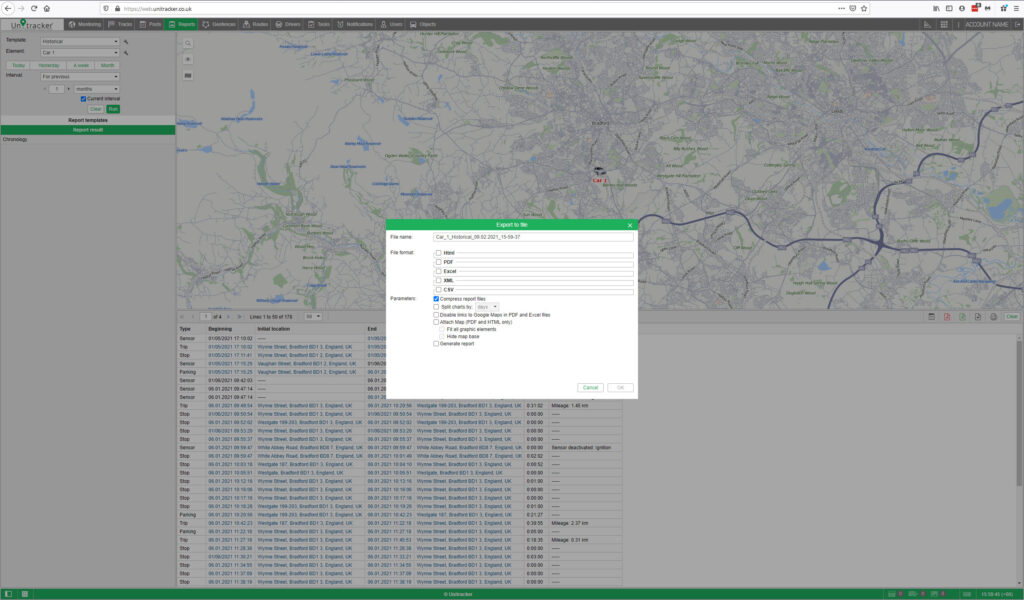

Charts


Besides the table view, some data can be presented in the graphical form. Go to the graphical mode to view the graphs of the parameters contained in the messages. The Chart Legend section opens in the work area to the left. Here, select the parameters you want to be displayed. You can check several parameters simultaneously — in such a case the graph contains more than one curve. For convenience, these curves are highlighted in different colors.

The commands sent to the unit by users are displayed on the Sent Commands request.

There is a special button in the monitoring panel to send commands to units.

The table includes:

Time
The time when the command was sent to the unit.

User
The login name of the user who performed the command.

Command name
The command name as it is written in the unit properties.

Command type
The command type.

Parameters
For the commands that require additional parameters.

Execution time
The time when the command was executed. If the execution failed due to billing limitations.

Channel
The type of connection used to transmit the command.
Reports
To switch to the Reports tab, click on the Reports header in the top panel and select the same name item in the main menu customiser.
Reports on the activity of a unit can be presented in the form of tables and graphs. They can be viewed in a browser window, as well as exported to files of various formats.
The Reports tab can be divided into four sections:
  • In the upper left corner, the report parameters are adjusted;
  • In the lower left corner there are report templates.
  • In the upper right section, there is the map;
  • In the lower right section, you see the report itself.
The sectors can be resized (the left ones — in width, the right ones — both in width and height). To do this, click on the border between them with the left mouse button and while holding it, move the border to the right/left or up/down. At the same time, if less than 10% of the map is left while expanding the lower sector, the map automatically collapses. To expand it, press the line under the top panel.
To generate a report, set its parameters (template, object, time interval) and click Execute. The report runs in the background. Once executed, the message at the bottom of the screen appears and the icon in the Reports tab starts to flash.

Template
Select the required report template from the drop-down list. By default, the one that was created and edited last within the current session is selected. To the right of the list is the icon for editing the properties of the selected template.

Object
Select the system object that you want to execute the report on (the current user should have the Query messages or reports access right). Depending on the report type specified in the template, you can select a unit, unit group, user, driver, trailer, route, resource, retranslator, group of drivers or trailers, passenger or group of passengers. For the Unit group report type, you can specify more than one object. Click on the Add object button and in the drop-down list, select the required unit or unit group (shown in brackets). If specific objects are bound to the template, only they will be available in the drop-down list. To view/edit the properties of the selected system object, click on the icon to the right of it.

Interval
The report execution interval can be specified in two ways: manually or with the help of one of the available pre-set intervals. Use buttons Today, Yesterday, Week, Month to select a pre-set interval. If you press one of those four quick buttons, the report launches immediately (there is no need to press Execute). To select the interval manually, there are several options (the drop-down list to the right of the Interval field):

Specified interval – For such an interval you can specify the date and time of the beginning and end (to minutes).

Starts ‘From’ until today – Specify the exact start time. The current time will be automatically set as the end of the interval.

For previous – The number and the time interval (minutes/hours/days/weeks/months/years) for such an interval are indicated below. To select a numerical value for the interval, use the arrow keys or the mouse wheel. Valid values are from 1 to 99. Press and hold the arrows to rewind at an increased speed. When the Include current option is activated, the report is executed not for the last full period, but for the current one.

There are alternative ways to receive reports in the monitoring system:
  • Receive reports by email at the specified time.
  • Receive a report when an event happens.
  • Quick report generation from the monitoring panel.
After generating an online report, you can print it without first exporting it to a file. To do this, press the Print button, which is located above the active table or chart only when there is a generated report in the browser window.

In the left part of the Print Report dialog, you see the list of sections which are included in the report. Check those that you are going to print. On the right, you can preview these tables, charts, map, etc. To start printing, press Print. To exit, click Close.
To get a report as a file, press the Export to file button.

Specify the desirable file format or several formats at once. Supported formats are HTML, PDF, Еxcel, XML, CSV. For some formats, you may need to specify additional export options.

Reports in the form of files can also be received by email automatically – using jobs and notifications.

In the left part of the Print Report dialog, you see the list of sections which are included in the report. Check those that you are going to print. On the right, you can preview these tables, charts, map, etc. To start printing, press Print. To exit, click Close.
Geofences
A Geofence, is an area on the map that is important for user’s tracking purposes and requires special attention. Geofences can be used to control units’ activity in these areas or, on the contrary, outside them. You can choose an image for a geofence or add a description.
A geofence can have a shape of a line (for example, an avenue or any road), polygon (a city or park or plant), or circle with any radius.
Geofences are widely used in Unitracker LIVE. Along with the map’s visual enrichment, they can be used in reports, notifications, and units’ tooltips. Geofences can also be used as check points for route configuration. Geofence’s tooltip may contain dynamically updated images and videos from external sources.
To open the Geofences panel, click the corresponding name in the top panel or choose the necessary item in the main menu customiser. Afterwards, choose a mode which allows you to work either with geofences or groups of geofences. Note that geofence creation is available in the ‘Geofences’ mode only, while the other options can be used in the ‘Groups’ mode as well.
Map Geofence
Start working with geofences by choosing the corresponding mode.

Click on the New button. In the help window, you can see the instructions on how to create a geofence. Choose a geofence type on the left: line, polygon or circle. Then map a geofence.

Double-click on any place of the map to put the first point. Then add more points using the same method. Put the points as close or as far from each other as you want. To insert a point between two other points, double-click on a segment between them. To move a point to another place, click on it and holding the left mouse button drag to another place on the map. Then release the mouse button. To delete a point, just double-click on it.

Set Geofence Properties
Name – This is used while tracking units as well as in reports and notifications. It is a required parameter. It can consist of one or more symbols. Besides, you can specify caption color and size. It has sense if in User Settings the option ‘Display names of geofences on map’ is enabled.

Description – This field is optional. The description is displayed in the geofence tooltip. It can also be added to the geofence name if the geofence is used as the address source in reports. When you create a geofence, the description is filled in automatically with the address information taken from the first point you map. However, you can edit or simply delete it.

Type – Geofence can be of the shape of the line, polygon, or circle. For line, you also can indicate its thickness, for circle — radius (in meters or feet, depending on resource settings).

Group – While creating a geofence you can include it in one or several existing geofence groups. To do this, choose the necessary geofence in the dropdown list.

Image – You can attach any image to a geofence. An image can be chosen from the standard icons (the Icon Library button) or loaded from your computer by pressing the corresponding area and choosing the file you need.

Area & Perimeter – These fields are not editable, they are calculated automatically.

Color – This color will be used to render a geofence on the map and to display it in a unit’s tooltip and in extended unit information as well as some other places where next to the geofence’s name where a unit is located, is shown a square of the same color.

Visibility – Here you specify map zooms at which geofences will be displayed or not.

Save Geofence
When finished, press Save. If you would like to delete the geofence you have just made and start afresh then press Clear and start again.
While Tracking Online
Geofences can be displayed on the map (the ones that have flags in the panel Geofences are shown). Different regions can be selected by different colors and you can estimate the units’ presence in definite areas. If a geofence is displayed on the map, you can press Ctrl and put the mouse cursor over it to see its tooltip (name, type, list of units inside, etc.).

In a unit’s tooltip and in its additional information you can see its presence in geofences if the option Presence in geofences is enabled in User Settings.

In Notifications
You can be notified by email, SMS, online or by other means when your unit leaves or enters a geofence. It is also possible to set speed limitations and sensor range for a unit during its presence in a geofence. Besides, entering a geofence or leaving it can be automatically accompanied by an action: send a message to the driver, block the engine, change users’ access to this unit, and many others.

In Reports
Geofences can be used in reports as addresses (in the Location column), if the Use geofences for addresses flag is enabled in the Advanced settings block of the reports’ template.

Many tables are generated on the basis of geofences. Among them there are the following:

Geofences – Visits to geofences (all entries and exits to/from the selected geofence(s) are given together with visit duration, distance travelled within the geofence, average and maximum speed, etc.).

Non-visited Geofences – Geofences which were ignored (non-visited) during a period of time or on certain days.

Rides and Unfinished Rides – Rides from one geofence to another.

Geofences can be also used to filter intervals in reports.

When a report is generated, geofences can be rendered on the map.

In Routes
Geofences can be used as check points while configuring routes.
Routes
Unitracker LIVE provides an opportunity to track a unit that moves along a route. A Route is a set of check points each of which has a certain position on the map.
Schedule is a table which contains information about the time of passing through check points. One route can have many schedules attached to it. See the Schedule section for more information.
Round is a combination of a route, its schedule and a unit assigned to them. See the Rounds section for more information.
To configure a route, perform the following steps:
  • Create the route itself, that is, mark check points on the map
  • Create one or more schedules for this route.
  • Assign units to the schedules manually or enable automatic creation of rounds.
You can monitor the unit performance on route in different ways:
  • Following it on a special online timeline.
  • Getting notifications about the events related to the route.
  • Executing reports on the results of passing through the route.
To manage routes, click on the Routes heading in the top panel or select the corresponding item in the main menu customiser. Here you can configure routes and observe the progress of active rounds.
Drivers
Unitracker LIVE makes it easy to create and manage the list of drivers using your vehicles. You can assign driver to a unit, i.e., attach to a vehicle. Then in the reports on this unit, a driver will be indicated. It is particularly useful when several drivers use the same vehicle. There is also a way to detect drivers automatically, drivers can also be put in to specific groups if needed.
To start working with drivers, choose the ‘Drivers’ tab in the top header bar.
You then have two options ‘Drivers’ or ‘Groups’
While Tracking Online
The name of the driver is displayed (if available) in unit’s tooltip and in extended unit information. To activate this option, check Driver in user settings. The photo and phone number is also displayed if available. Drivers can be located on the map at any time.
In Notifications
Drivers appear in notifications. You can configure a notification to get informed when a driver is assigned to a unit or unbound from it or when certain criteria are met.
In Reports
The drivers can be also mentioned in reports relating to tables such as – Trips, Engine hours, Rides, Unfinished rides, Fuel fillings, Fuel thefts, Speedings, and some others. To see drivers in a resulting report, choose the appropriate column in the report template.

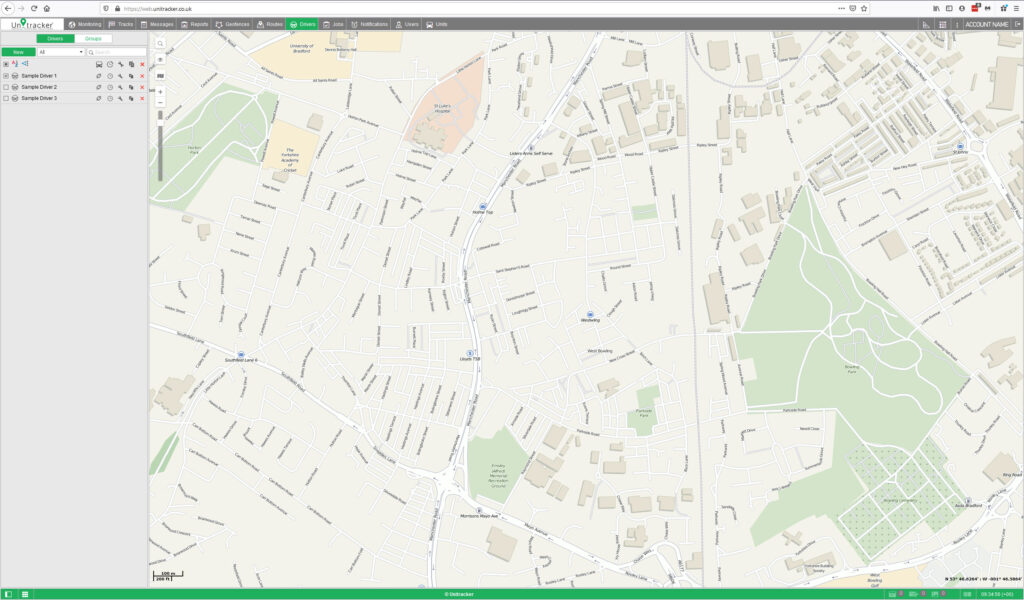
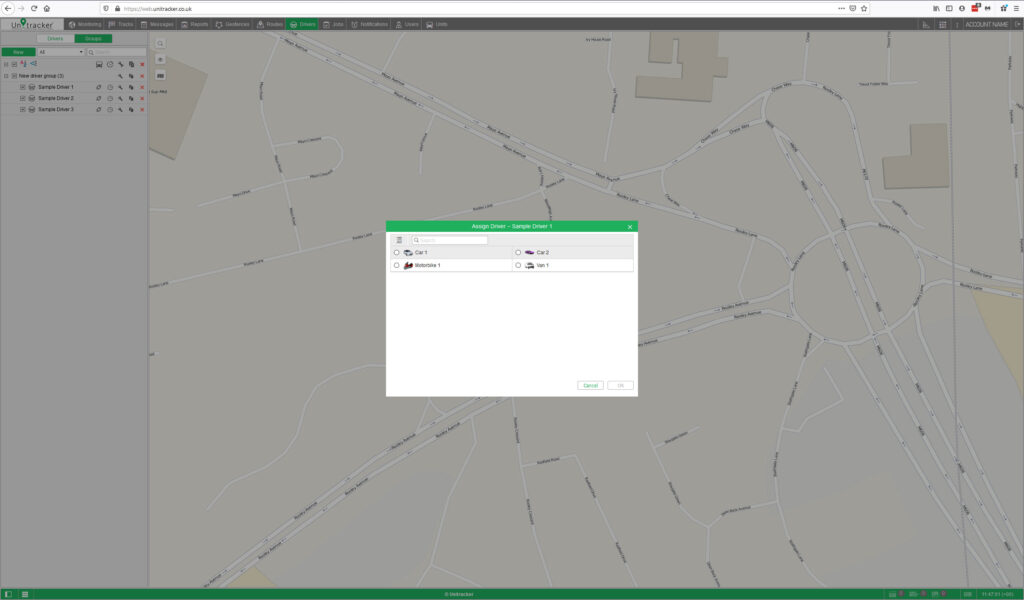
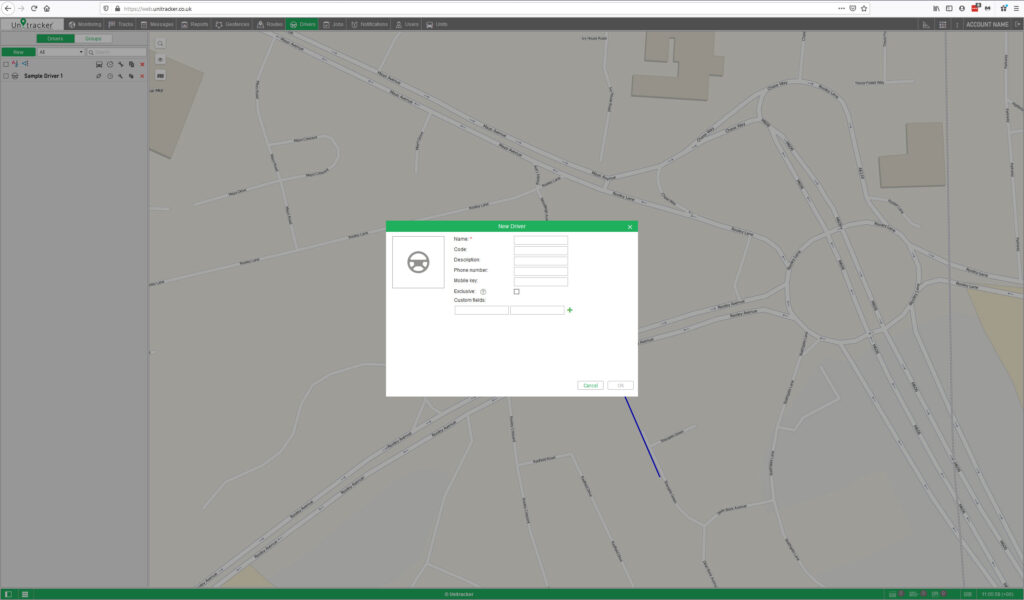
In the header bar choose the ‘Drivers’ tab and click the ‘New’ button.


At the end click OK. The new driver appears in the list.


Name – Give thew driver a name that will be visible during the tracking process and in reports.


Code – Enter unique driver code needed to identify the driver if an automatic method of binding will be used. Codes of different drivers should be different.


Description – Type any comments (optional). It is shown in driver’s tooltip.


Phone Number – Enter driver’s phone number. It will be shown in driver’s tooltip and can be used to send SMS messages to the driver and make calls. Note that units or drivers with the same phone numbers cannot exist in the system. If you attempt to create a driver with a phone number that is already reserved to another driver or unit, a special alert will be displayed, and this phone number will not be saved.


Mobile Key – Password for mobile authorisation.


Exclusive – If this flag is enabled, this driver can be the only one assigned to a unit. In case you bind this driver to a unit (in real time) which already has one or more assigned drivers, those drivers are reset automatically. This flag works only for drivers within a common resource.


Custom fields – Create driver’s card adding any information as custom fields (information may include external links). They are shown in driver’s tooltip and can be summoned in reports. Note that custom fields with the same name cannot coexist within one particular driver.

Several drivers can be assigned to a single unit. To assign drivers to units, you should have the Create, edit and delete drivers access right towards the resource where those drivers belong.There are two ways to bind a driver to a unit: Manual and Automatic.

Manual Binding
The manual assignment can be performed in sections ‘Drivers’ and ‘Groups’ within the ‘Drivers’ tab in the header bar. Use the Bind / Unbind icons to attach or detach drivers to/from units.

Click on the Bind to unit button , choose a unit for the driver to be bound to, and click OK.

Availability of units in this list depends on the work list in the Monitoring panel. If there are no units in the list, click on the Add all available button . To unbind a driver from a unit, click on the icon of the unit next to the driver’s name and click on the button .

Automatic Binding
To detect a driver automatically the corresponding equipment should be installed. For instance, contact memory devices, digital electronic keys (e.g. RFID chips) are widely used in personnel access control systems.

When getting into the vehicle, the driver applies the electronic key to the reader connected to the tracker. If the parameter received from the tracker contains the key code, the driver gets bound.
Drivers you have created can be put in to groups, these can be created to suit any criteria and are used to create group reports.

To start working with groups, choose the ‘Groups’ tab in the left hand panel.

To create a new group of drivers, click the ‘New’ button and enter the name and description. The drivers that form the group are chosen in the list at the left. The contents of the list can change according to the option chosen in the filter above. It can display all the drivers, a group of drivers (the names of the groups are shown in brackets) or the drivers outside groups. Move necessary drivers to the right list using double clicks or the ‘Add’ button, then press ‘OK’.

A list of created driver groups is displayed in the work area, which is arranged alphabetically.

Drivers not assigned to a group can be found in the Drivers outside groups.
Jobs
A job is a set of actions executed according to the given schedule. Jobs can be of different types, such as executing a command, changing access to units, sending a report by email, and so on.
To configure jobs, open the Jobs panel by selecting a corresponding name in the top panel or clicking on the Jobs item in the main menu customiser. Here you can see the list of all created jobs and information on their state.
In the list, the jobs are sorted by name. You can search by job name or part name with the search box. You can also filter jobs by the resource they belong to. To do this use the drop-down list.
The tooltip that appears when you pause the mouse cursor on the job name displays the complete information about the job: job type, parameters, schedule, time of last attempt of job’s execution, resource (if there is access to several), and other parameters depending on job configuration. In columns on the right, you can see the job’s state (on/off), the number of executions already made, and the number of maximum executions allowed.
The system supports running a test execution of a job. Test execution is a single execution of a created job regardless of its activation time and the number of executions indicated. Test execution is performed within one minute after clicking on the corresponding icon in the work list. The result of the test execution is recorded in the log. Moreover, you can view the information in the corresponding report on a user. Note that during the test execution of the job, the icon becomes inactive until it finishes.
Notifications
You can be notified about any unit activity or change in its state. It can be speeding, change of location, sensor values, etc. A notification can be delivered by email or SMS, or shown online in a popup window. To create, edit, and view notifications, open the Notifications panel by choosing the Notification tab in the main header menu or clicking on the necessary item in the main menu customiser.
How to Create a Notification
Click the New button. Choose unit(s) for which you want to create a notification and click Next. Units are selected in the same way as in jobs. Here you can learn more about job creation and editing.
Select the trigger type: geofence, speed, alarms, sensor values, message parameter, and so on.
Click Next. Here you can learn more about notification types.
Adjust control parameters required for the notification type selected in the previous step: select geofences, indicate speed limits, and so on. Click Next. Here you can learn more about notification parameters.
Enter the text for the notification using special tags listed in the table below. They will be substituted with real values when notification triggers. Indicate how the notification should be delivered: sent by email or SMS, pop up online, registered in the unit history, etc.
Name the notification and set a schedule for its execution.
Click OK. The created notification appears in the list in the left part of the window.
Users
Each User you set up will have a unique name (login) and password. Users can login to Unitracker LIVE where they can control their units with the help of different tools and features. Different users can have different access rights and, accordingly, see a different set of monitoring units and other system objects, create their own geofences, report templates, and so on.
Working with Users
To work with users, open the Users panel by choosing User tab in the main header menu or click on the Users item in the main menu customiser.
Units
A unit is a vehicle, equipment, person, or any other moving or stationary object that can be monitored using satellite monitoring.
The Units panel is used to create new units manually or to view, edit, copy, delete units, export their properties, and send SMS messages to them.
To work with units, open the Units panel by clicking the Units tab in the main header bar or select the item in the main menu customiser. Two modes are available in the Units panel: Units and Groups. Note that by clicking the New button in the Units mode you create a new unit while in the Groups mode you create a new group of units.
To create a unit, click New, fill in the fields of general properties, and press OK. The created unit appears in the worklist. In addition, a unit created in the monitoring system or CMS Manager automatically appears in the worklist of the Monitoring panel.

Units are listed in alphabetical order. Each unit has an icon. To quickly find the required unit, use the dynamic filter. Such information as the unit type, unique ID, and phone number(s) can be found in the unit’s tooltip. To view the unit’s tooltip, the Edit connectivity settings access right to the unit is required.
Created units can be formed into groups. Groups are used to unite units on the basis of some criteria. To work with unit groups, choose the Groups mode in the Units panel.

To create a group, click New, fill in the fields of general properties, select units, and click OK. The group will appear automatically in the worklist of the Monitoring panel.

The list of created unit groups is displayed in the work area. Groups are listed in alphabetical order. To the right of each group name, you can see how many units are included in it. The names of units included in the group are listed in the group’s tooltip. To quickly find the required unit group, use the dynamic search above the list.
  • A group can be used to give the user access to several units at once.
  • With groups, access to a unit can be expanded but not narrowed.
  • The creator of the group must have access rights to units in this group.

Working with unit groups is easy. Deleting a unit group does not delete the units themselves. That is why you can create, edit, and remove unit groups, that is, configure the groups according to your needs. You can also configure automatic editing of groups with the help of the notification of the Modify unit groups type. When the set conditions are met, the unit can automatically be added to or removed from the group.

Features

With Unitracker, you can have eyes all over the fleet and its routes with the latest camera equipment with 3g capabilities installed on the dash. The 3g technology establishes visual communication between the fleet and the managers who wish to access it at any given time to monitor the activities live. It is also a good measure to avert any chances of theft or false insurance claims.
Driver safety is a key consideration for Unitracker, which is why our tracking kit comes with crash sensors that are activated when collisions are detected. On activation of these sensors, the fleet managers are prompt notified of the incident and safety system is enabled to minimises injury to drivers.
Driver behavior is primitive for the driver and cargo protection, which is enforced through monitoring of patterns and habits observed during the driver’s working hours when en route. By collecting the minutest details like speed, engine idling, driving time, routes taken and summation of driving time among others, fleet managers can identify poor driving habits and attempt to correct them for better performance.
Authorization through identification system integrated in each vehicle using Unitracker strengthens the security of your fleet as each driver must scan their identification to activate the engine. With these ID cards, fleet managers are equipped with a robust system that is able to collect crucial data related to each driver’s performance like working hours, engine idling, driving behavior, personal and business mileage and more. This information can be used to reward good performances and rectify habits in poor performances.
Use the geofencing system in Unitracker to set up virtual zones that restricts the fleet vehicles to certain areas. Fleet managers are notified if the defined zones are breached or if a vehicle enters it. This is effective in route management, theft risk minimization and unauthorised usage prevention.
As fuel makes a major chunk of expenses in businesses, smart managers are aware that it must be dealt with to reduce costs and improve efficiency. Engine idling is underestimated as a cost contributor as drivers assume that returning to the vehicle in “just a minute” does not translate into much when the opposite is true. Managers can track drivers with high idling times and rectify these inefficient behaviors with proper measures.
With this feature, you can protect your assets or vehicles from getting compromised by remotely rendering your vehicle Immobilise so it is unable to be used by unauthorised persons. This can minimise your losses and assist you in recovering your vehicle if it gets stolen.
Follow your vehicle wherever it goes and keep a close eye’s watch on its movements with sophisticated motion sensors. Even if the vehicle has the ignition off, the sensors will pick up any movements and send alerts to your system about its location.
Set off SOS alerts to fleet managers in emergencies with a panic button installed discreetly in your vehicle and enhance driver safety. Receive alerts as notifications on your system, SMS or emails with each alert recorded as history for follow up, review or analysis.
GPS-embedded Unitracker transmits real-time location to the system to the accuracy of up to a minute. Never lose sight of your vehicle’s whereabouts, no matter how large your fleet is. Unitracker is capable of providing the precise live location of multiple vehicles on the road to ensure that they do not deviate from the set routes.
The incorporation of PTO makes Unitracker an energy-efficient system that enables the reuse of the power produced by the engine to run auxiliary equipment. With PTO, your vehicle can act as a power source for heavy machinery, especially required in industry settings, extending the functionality of the vehicle. Do more with little and increase the productivity of your business.
Tracking of mileage without driver identification allows the preservation of employee privacy while recording the performance of your business associated vehicle. It enables you to remain on top of your business while giving your employee the space for personal time. Disable location tracking for non-working hours while recording mileage. Distinguish personal and business mileage accurately, the latter that requisites compensation.
Real-time transmission of important data like location, temperature, driving hours, driving patterns, average or maximum speed and fuel consumption through satellite receivers. This telematics can be remotely downloaded to examine information about driving (tachograph) and get an overview of vehicle or driver performance, enabling the automation of the process. Improve decision-making with useful logistics data.
Records temperature inside the vehicle and transmits it to the system in real-time. This feature is advantageous when carrying temperature-sensitive cargo. Emits alerts and alarms if abrupt changes occur or if the temperature exceeds or drops a certain threshold that could potentially result in damages.
Plan and schedule maintenances for vehicles and assets periodically. Receive notifications when maintenance is due or on service completion. Collect and store maintenance information to be retrieved and presented as customised reports to acquire key insights to optimise your business operations.
Automated logging of mileage and details related to every trip taken such as miles travelled, arrival and departure time, fuel usage and routes traversed. Mileage logging is essential to businesses as it contributes to operational expenses and should be recorded accurately. Unitracker not only simplifies but automates the logging process and facilitates the generation of mileage reports for fair compensation and tax return completion.
Fuel sensors are installed in vehicle tanks to collect real-time fuel usage data for each vehicle and its journeys. Fleet managers can use this data to promote driver safety and make efficient decisions about cutting down fuel costs. Reduce fuel costs with Unitracker by taking more optimised routes for delivery. Analyse fuel consumption history for certain periods for discrepancies and variations that suggest theft or overconsumption.
Emits alerts on detection of alarms on various events such as breaching of virtual zones, temperature rising or dropping, unauthorised usage, deviation from the planned route, collision with objects or other vehicles and more.
Unitracker maintains continuous GPS connection with the target vehicles and assets with information live streaming over cellular networks for efficient performance with high availability. If the GPS is disconnected due to technical problems or deliberate sabotage attempts, the Unitracker application detects it immediately and notifies the business with alerts so it can be corrected to minimise loss.
Notify fleet managers about low battery or disconnection with the continuous monitoring of battery levels. Unitracker ensures the safekeeping of vehicle batteries by discouraging their theft with a disconnection detection mechanism.
The high-quality services of Unitracker demand 24/7 availability to keep the businesses profitable and stay connected to their vehicles on the road. If interference or disturbance with GPS or GSM is perceived such as in the case of jammers in proximity, Unitracker is equipped with jamming detection mechanism so fleet managers are notified promptly so measures are taken to reduce the likelihood of adverse activities.
The RFID card system is employed in Unitracker. These tags or cards hold driver details and profiles that are recorded in the system to be retrieved for any assessments or analysis. Tags or cards are used to authorise drivers to be able to drive the vehicles and protect them from any unauthorised access.
Untracker’s tracking equipment is consistently available to provide top-grade fleet tracking services and keep managers linked with the daily on-road activities. Detection mechanism in case of tracker or CPU disconnection such as in cases of theft or sabotage is immediately reported to the system for swift action.
View the essential information related to your trailers whenever you want, from wherever you want using Unitracker. The flexible, cloud-based application lets you take swift actions to mitigate risks and minimise losses as you receive live updates from the ground, directly to your screen. With the use of identification, protect your trailers from unauthorised access and misuse.
Overspeeding is a hazard, especially on a rough and unruly road. The Unitracker system detects the road texture and defines appropriate speed limits to reduce accident risks and protect the bystanders as well as the driver.